It’s really important to me that we build the most impactful features for our customers. In almost every call I have, one of the most common recurring themes is measuring the ROI of data investments. So on our journey to help customers get more from their data, we wanted to make it easier to measure how users already are (or aren’t) using data.
Nowadays, understanding how we use applications is not only critical but (thankfully), it’s also becoming increasingly common. For instance, Slack provides insights on top conversations and essential metrics like emoji usage. On LinkedIn, you can see your most engaged followers and posts. Now even Spotify users eagerly anticipate their 'Spotify Wrapped' summary. Everyone wants data.
So here’s the story of how we built usage analytics into Omni using Omni (from my lens, as a product person who knows just enough SQL to be dangerous).

Building Omni usage analytics (with Omni) #
As a product manager, a very important aspect of my job is understanding our customers and their experience with our product. Two crucial ways I do this are: 1) talking directly to customers and 2) analyzing usage data. From exploring our product usage data, I knew we captured insights that could help our customers measure and improve their data ROI.
Here's how we took this from raw data → production (in less than a week)!
Getting the raw data #
Since we started shipping Omni, we’ve captured logs rich with usage information. We combine it with a replica of our internal database tables that revolve around key app entities (e.g. users, models, and dashboards), put all that data into Snowflake, and connect Omni right on top.
The good: we have lots of data available to use.
The bad: there are so many tables and fields, it’s hard to make sense of everything available. On top of that, most of the log data is stored in JSON, which requires some work to understand everything contained in the fields.
Ad hoc exploration #
As it turns out, Omni is pretty great for exploring new datasets 😀
I opened a new workbook and used our point-and-click interface to quickly preview potentially interesting tables. Since Omni intuits join paths, it was also easy to connect tables together without having to figure out the SQL.
The next step was dealing with JSON - where all the good stuff is located. Omni has a nice little right-click action to unnest JSON directly, automatically writing the functions to unnest and transform it for easier exploration.

From there, it was easy to preview what types of insights we could provide. At times, I also dipped directly into the SQL to tweak something, such as cast a field or create a case statement.

I always find it fun to be an end-user of a product I help build. While I noticed a few things for improvement (what product manager doesn’t find things to improve?), I was also reminded just how fast one can explore in Omni. I navigated through data and made tweaks on the fly - without the need to build a comprehensive model upfront. I especially appreciated this since I started not fully sure what I was looking for 😅
From iteration to promotion #
I continued to discover insights customers may care about, such as: Who are their most engaged users? What types of data are people looking at? What fields are most used? What content is most viewed (or least viewed)?
At this stage, I built a dashboard so teammates could review and help iterate. Once I incorporated internal feedback, it was time to segment the relevant data.
Segmenting by customers #
Our row-level permissions and user attributes made it easy for me to tie each organization to its own data, so we could securely make this available to all customers.
To make this reusable at scale, I converted all of my SQL queries into modeled concepts and took any metrics I cared about to ensure that logic was centralized in the model. It was easy to take the ad hoc explorations we liked and promote them to the model to ensure we could use them again - building repeatability and governance into the model and my workflow.
Now, it was time to get it in front of customers! First, we scheduled emails containing the dashboard to beta customers. Based on their feedback, we continued to iterate and add.
Shipping it to the product #
From there, we still wanted a more dynamic way to share this information with our customers. Since we just released the ability to embed Omni in other apps, we figured why not embed Omni in Omni? 🤷
Additionally, this created the perfect opportunity to be our own first beta customer to test our embedded functionality. Many members of our team, myself included, came from Looker where the app performance and lack of customizability didn’t support a positive embed experience. At Looker, we custom-built the usage dashboard to avoid the embed experience. At Omni, we’re not compromising on UX, visualization, or performance, which means we’re proud to embed back into our own product (with the intention that customers will have a similarly positive embed experience!).
And so, it was time to build it to test and ship. Getting the usage analytics dashboard built into the product took less than half a day:
First, I collaborated with one of our engineers to build a new page within Omni to host the new dashboard (welcome to the world Omni/analytics). In less than two hours, they had it ready to go!
Next, I gave them the iframe link to the dashboard with row-level permissions to filter the appropriate data for each customer.
That’s it; it was ready to ship 🚢
Omni usage metrics #
The Omni usage dashboard is now live for customers to see (segmented by just their own data, of course!).
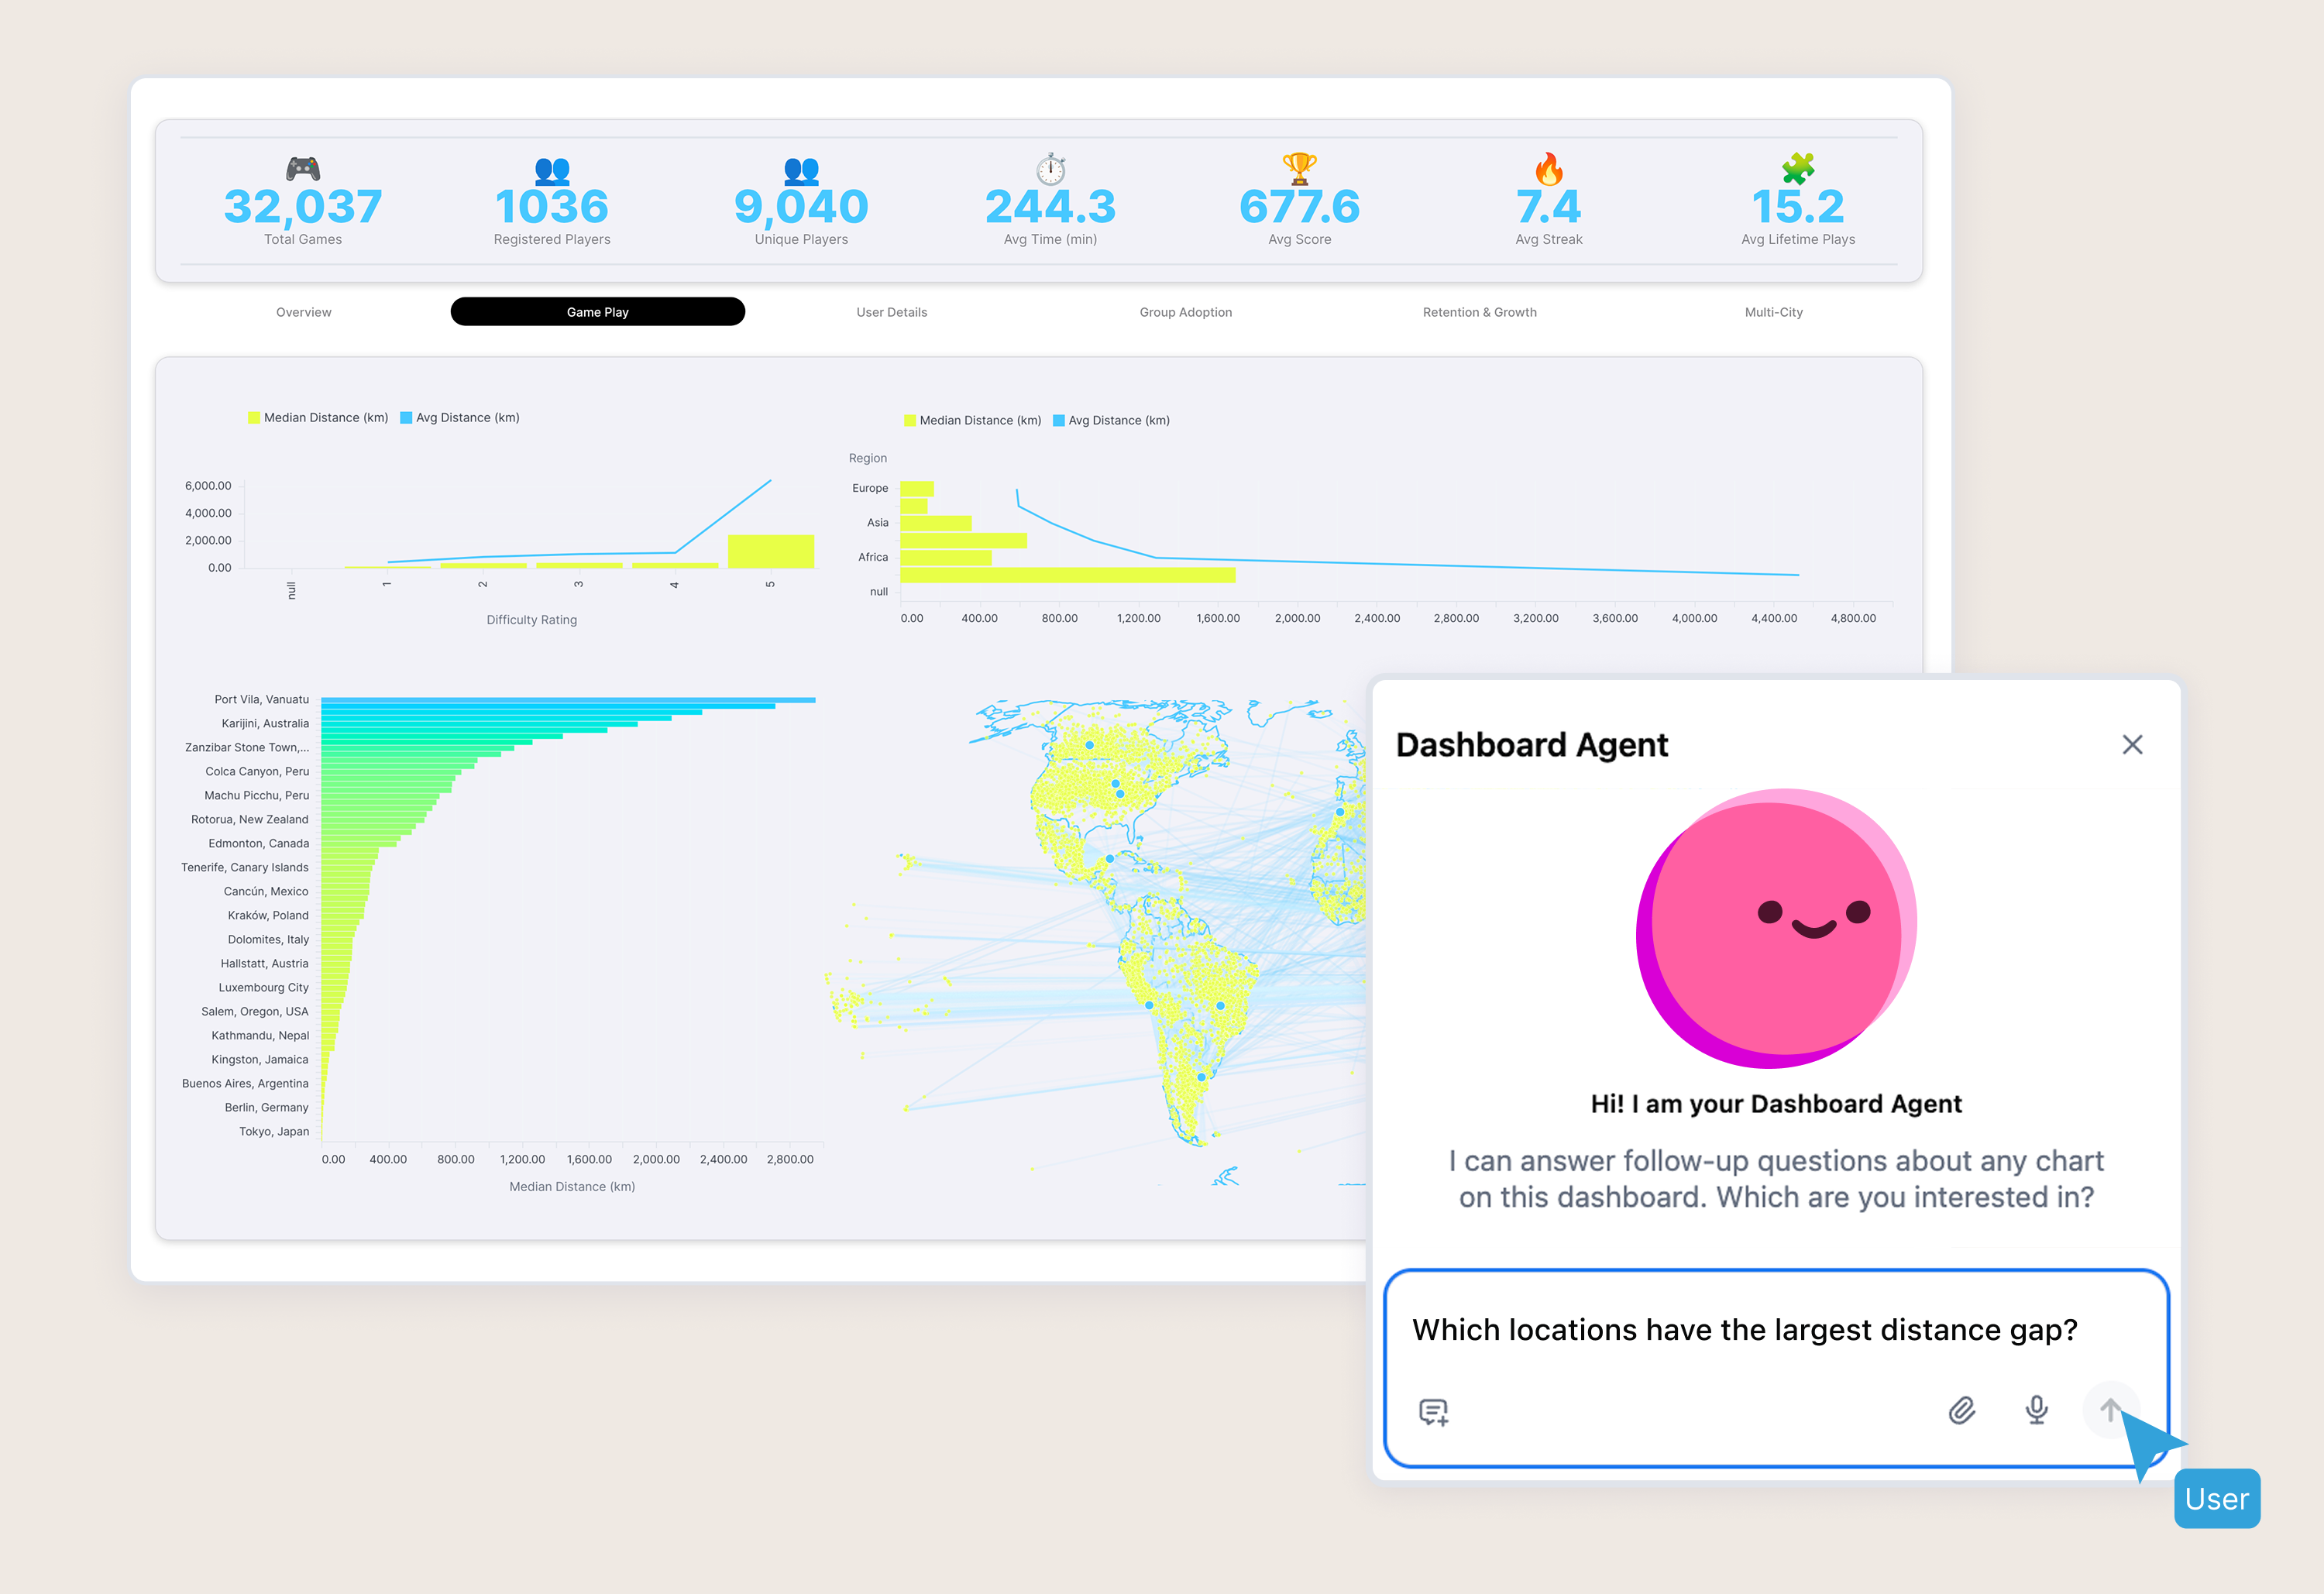
Today, you can use this dashboard to track high-level metrics such as active users, questions asked, and time spent analyzing in Omni. But you can also get deeper, more contextual insights into user behavior and content (e.g. dashboards and fields) engagement over time.
As we gather more feedback over time, it’s easy to add and iterate - without requiring any more engineering time; I can modify the dashboard myself and it updates in the iframe live.
Building product as a PM #
As product managers, we often have just enough skills to be dangerous but not enough to ship a product fully on our own (which is why we work with such talented cross-functional teams 👯). We can dabble with data, tweak a design, and maybe hack an iframe into a page. When it came time to ship our own data product inside Omni, I was delighted to prototype, build, and deliver something without hassling too many people and having to turn it into a largely scoped and resourced project. Best of all: our customers now have a deeper view into their usage to help them answer questions about ROI and increase the impact they drive with data.
So, if you’re an Omni customer be sure to check out /analytics and tell me what you think! And if you’re curious to learn more about embedding Omni, check out our docs and stay tuned for lots more coming here 😉