Our team likes to game, enjoys helping customers with gaming analytics, and never passes up an opportunity to have a little fun with our work. So, when brainstorming a fun experience to complement our coffee and donut truck at Snowflake Summit, we decided to create a data-themed video game for attendees to enjoy during downtime. 🎮
After the conference, we couldn’t pass up the chance to explore the data from the game. In this blog, I’d love to share the process of analyzing the data in Omni and what we found!
(Note: We’ve trimmed and blurred any product content to avoid showing sensitive player data.)
Before I get started, here’s a look at the game: you play as a byte-sized data analyst on a quest for insights while dodging SQL errors, row limits, and data quality issues along the way.

Loading... #
Getting the data into Omni #
Like a lot of gaming data, ours was stored in JSON. We use Snowflake, which handles JSON data quite well, so we loaded it into Snowflake using Snowsight and then accessed it in Omni with our Snowflake connection.
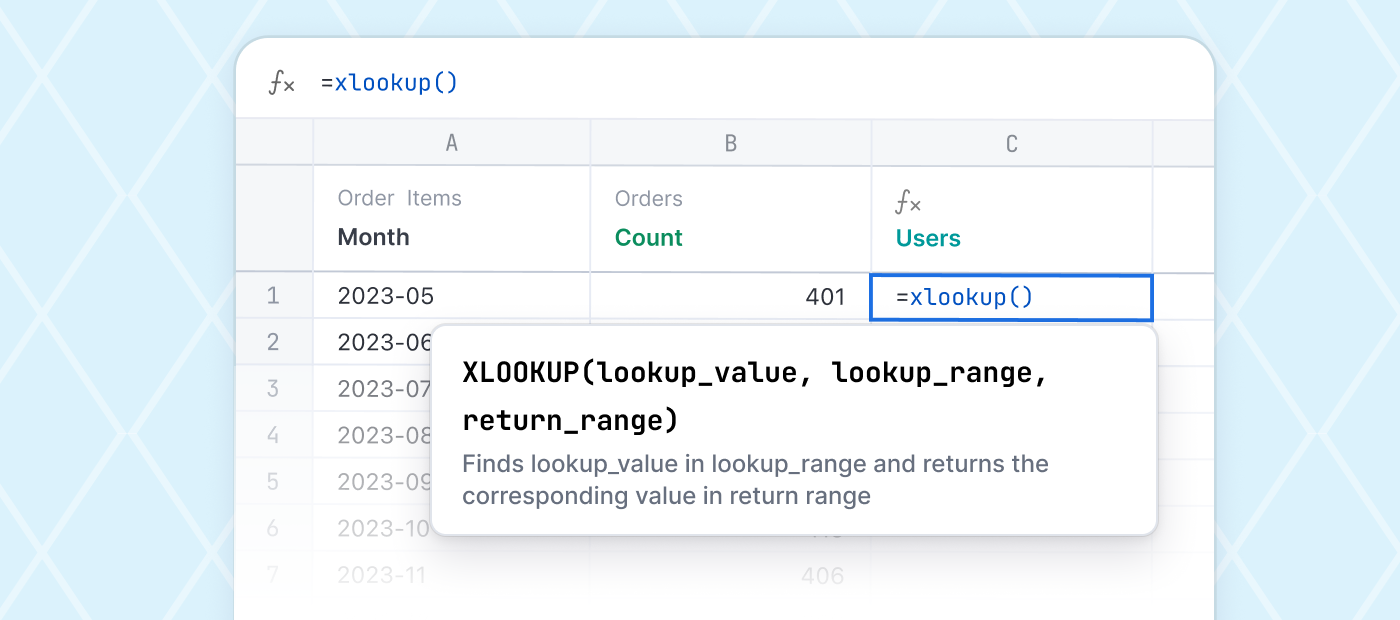
Creating columns from JSON #
With Omni’s point-and-click JSON parsing, we quickly created multiple columns from our JSON column, unlocking access to individual fields in a jiffy.

Cleaning the data, with the help of AI #
Our data was pretty simple, so there wasn’t too much to clean. But before starting our analysis, we filtered out Omni employees to avoid skewing the data. (We may or may not have spent an entire Friday afternoon playing the game – for QA purposes, of course).
We took a few steps to do this:
To identify Omni employees, we needed to parse the email domain from the Email field. The formula to extract that substring is a bit of a headache to write using SQL, so we enlisted the help of Calcs AI, asking it to
extract domain from email.
We checked that the logic was correct, then promoted that field from an Excel calculation to a field in Omni’s data model. That made it easy to exclude Omni email domains by adding a filter on that field.

Finally, to fine-tune our exploration experience, we turned our data into a Topic, a curated data set in Omni. We could then apply an
always_where_sqlparameter that always filters out Omni employees whenever we’re in this Topic. We added this parameter to the model file that Omni captures behind the scenes.
With our data ready to go, we started our analysis!
Ready, set, play! #
Level 1: Basic game stats #
Our first step was spinning up some metrics to help us see overall usage trends. To do this, we used point-and-click quick aggregates.

Then, we sliced these measures using some time frames automatically generated by Omni.

We created a few visualizations on a dashboard and shared it with our team. Here’s one of the tiles that we found most interesting:

We discovered that most game activity was logged on Thursday, the last day of the conference. I think this likely has to do with a change in the audience. It was Developer Day, which might have meant more gamers were attending; and since the conference was wrapping up, folks may have had more time to play as they traveled home. It was also fun to see the most common activities in the game, from collecting coins and avoiding obstacles to jumps 🏃 and collecting power-ups ⚡.
Level 2: Predicting scores with linear regression #
Of course, the Omni team wanted to know one crucial thing from this data: what’s the best strategy to win? Do you go for the most coins? Avoid the most obstacles? Collect the most power-ups? 👀
We approached this question using linear regression to see which variable – coins collected, obstacles avoided, jumps, or power-ups collected – had the smallest total prediction error (measured by the sum of the squared residuals). With Omni’s Excel calcs, we did this simple linear regression right inside our table.
Using a KPI visualization, we collected the sum of squared residuals for each variable to see which had the lowest prediction error.

Although it’s not the most robust analysis 😅, it looks like Obstacles Avoided has the lowest prediction error, suggesting that avoiding obstacles is the strongest strategy for getting a high score. Makes sense – you can’t increase your score if you’ve lost all your lives!
Play again soon? 🎮 #
We’re data nerds, so analyzing a new dataset was a fun exercise for us. Ours was simple, but if you want to dive into more complex analyses – understanding player retention, identifying highly engaged players, optimizing ad spend on acquiring new players, etc. – we can help you with that, too.
If you didn’t get to chat with our team in person at Snowflake Summit and you’d like to learn more, we’d love to show you Omni (and the game too, if you’re interested!).