New Table Features, Omni-98 Theme, Incremental Promotions, Impersonate User Mode, New Custom Visualizations and more!
April 19, 2024
New Table Features and Updates #
We’ve separated the results table and table visualization, meaning not all options will exist between the two. The results table is now focused around query manipulation and spreadsheet calcs, and the table visualization leans more into styling (like the new dimension grouping feature!).
Implemented frozen columns in tables, allowing users to freeze columns to the left of any non-pivoted value.

Users can now be able to leverage subtotals to enable dimension grouping and create collapsible table layouts - note this will be live next week!
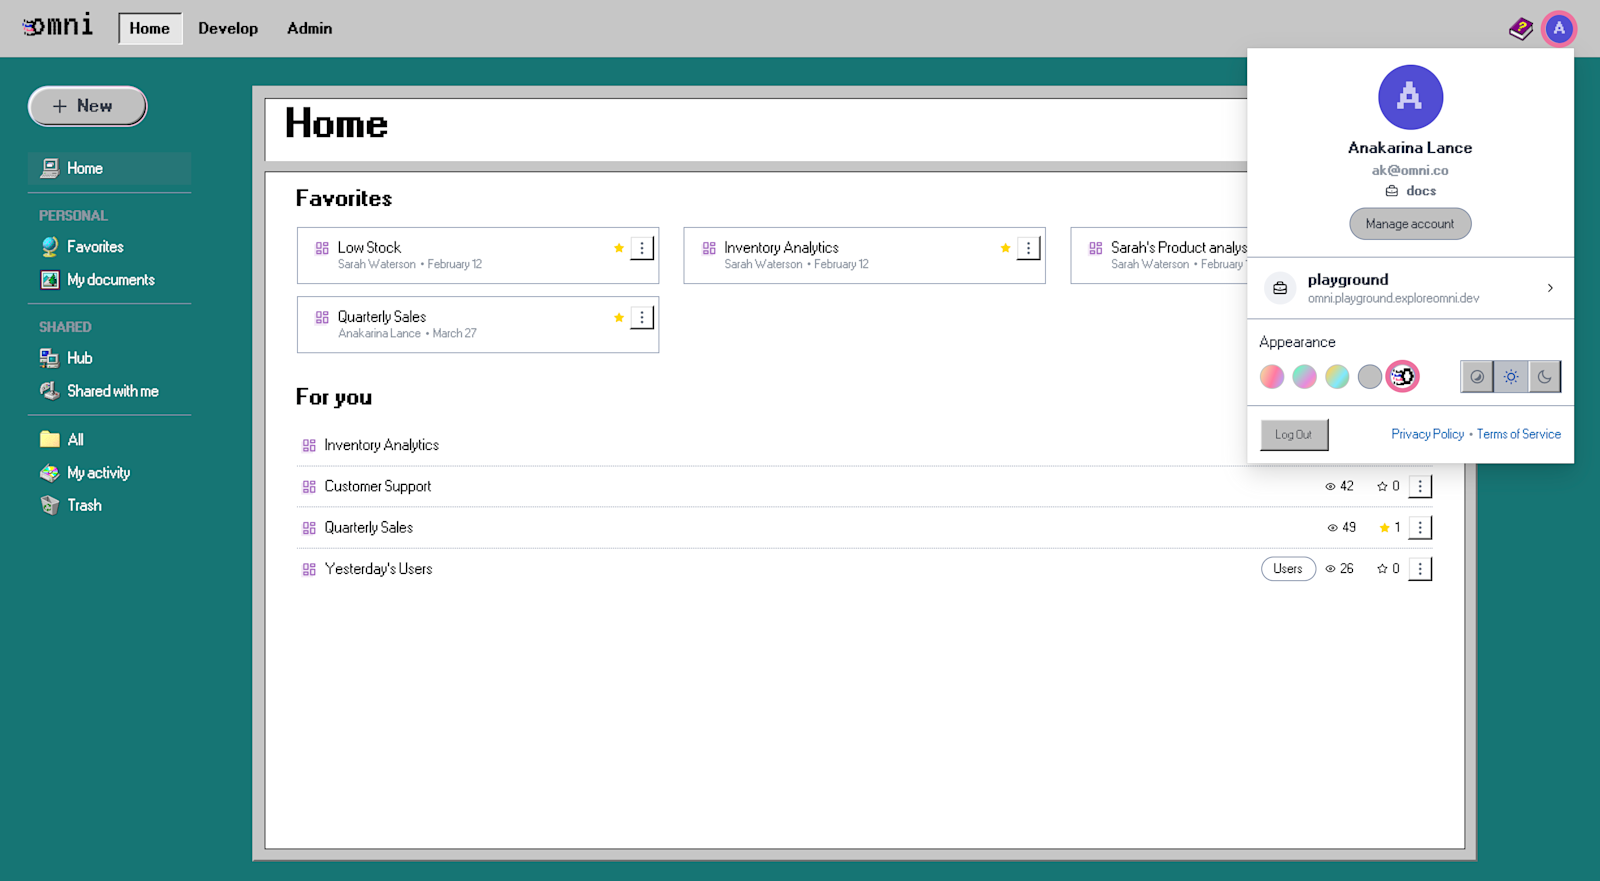
New Omni App Theme: Omni-98 #
Head over to your account settings and look for the slightly pixelated Omni logo for a blast from the past with the Omni-98 theme for your Omni app! :omni-98:
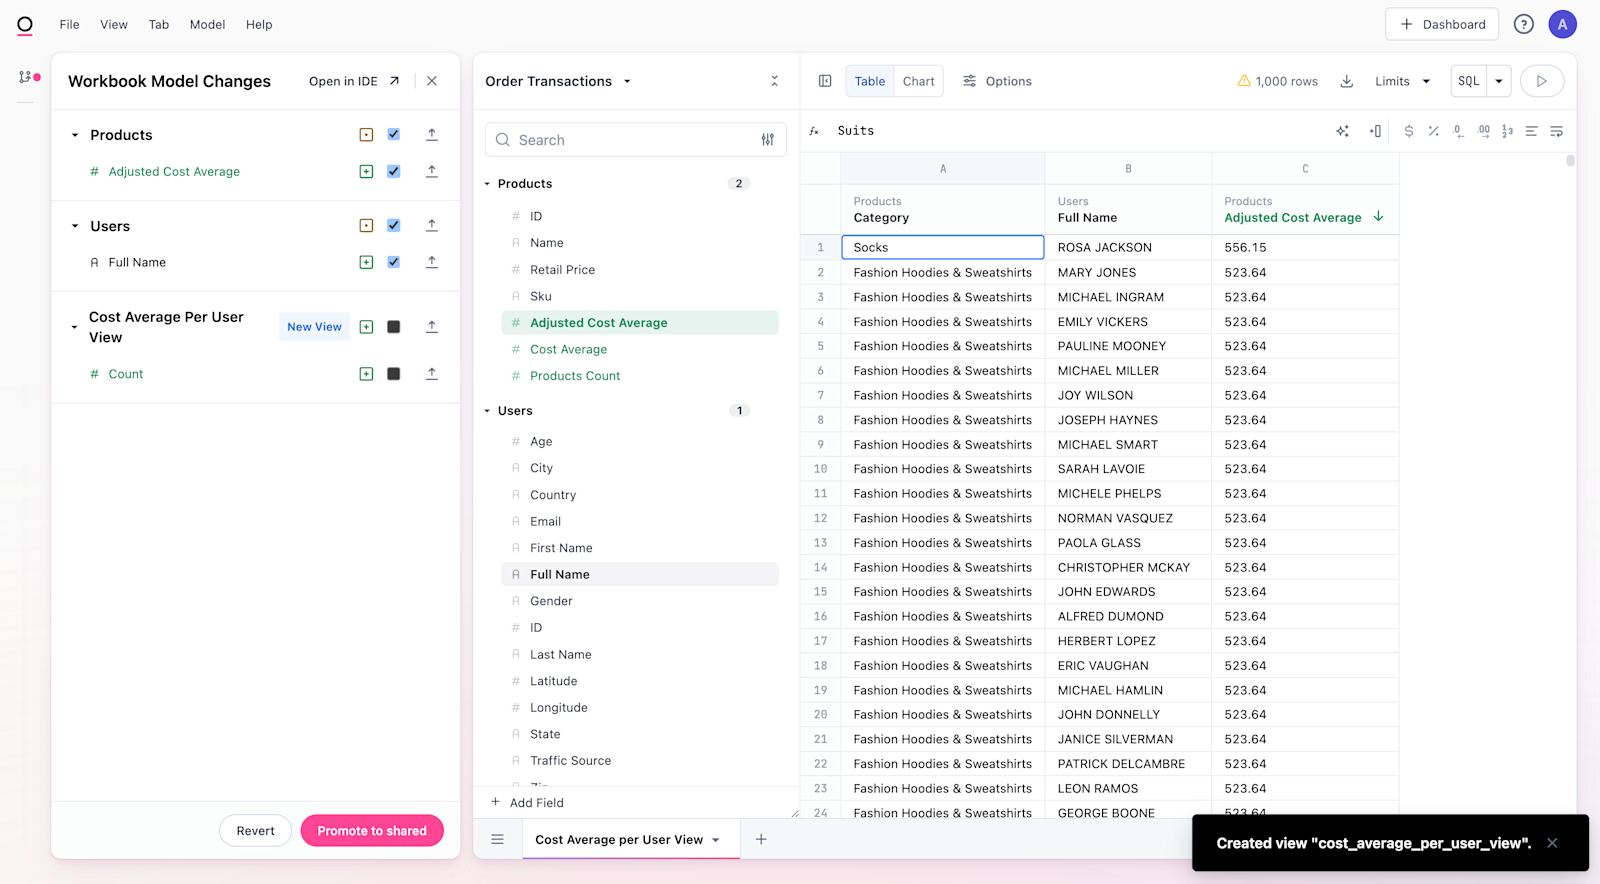
Incremental Promotion in Workbooks #
Users can now incrementally promote changes they create from their workbooks into their models. This feature allows users to move quickly in an analysis and decide which fields, relationships, views or topics should be contributed to the rest of the organization or left in the workbook layer with just a few clicks.
Impersonate User Mode #
We've introduced an Impersonate User mode for admins to step into the shoes of any non-admin user within the app. This gives admin insights into how another user's particular permissions, user attributes and filters may affect their Omni experience firsthand.

New Custom Visualizations #
Check out the sample code for these custom visualizations in our docs!
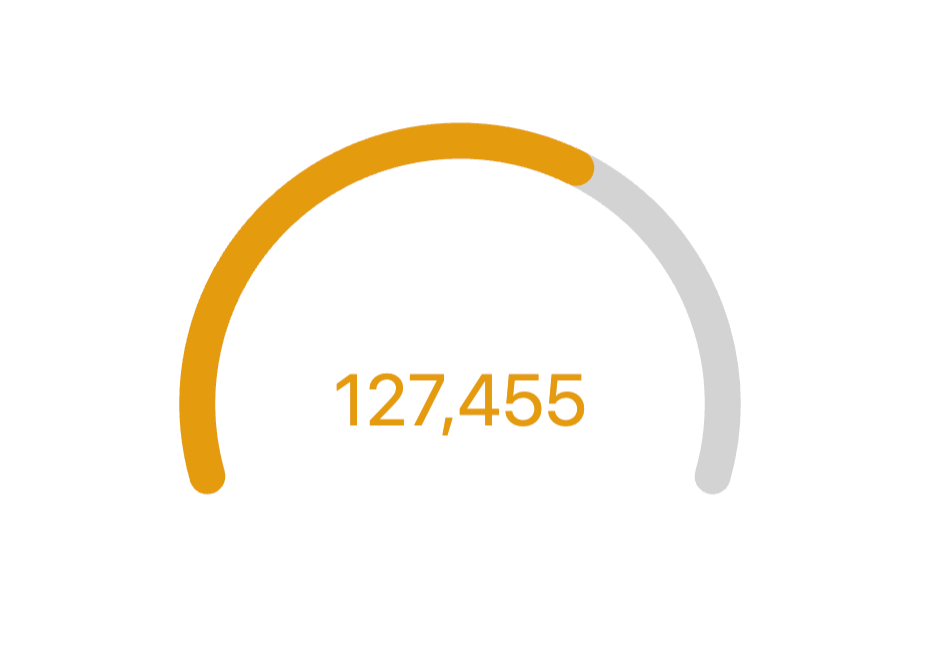
Gauge charts #
Gauge charts, also known as dial charts or speedometer charts, for visualizing your goal targets, health metrics, or monitoring performance.
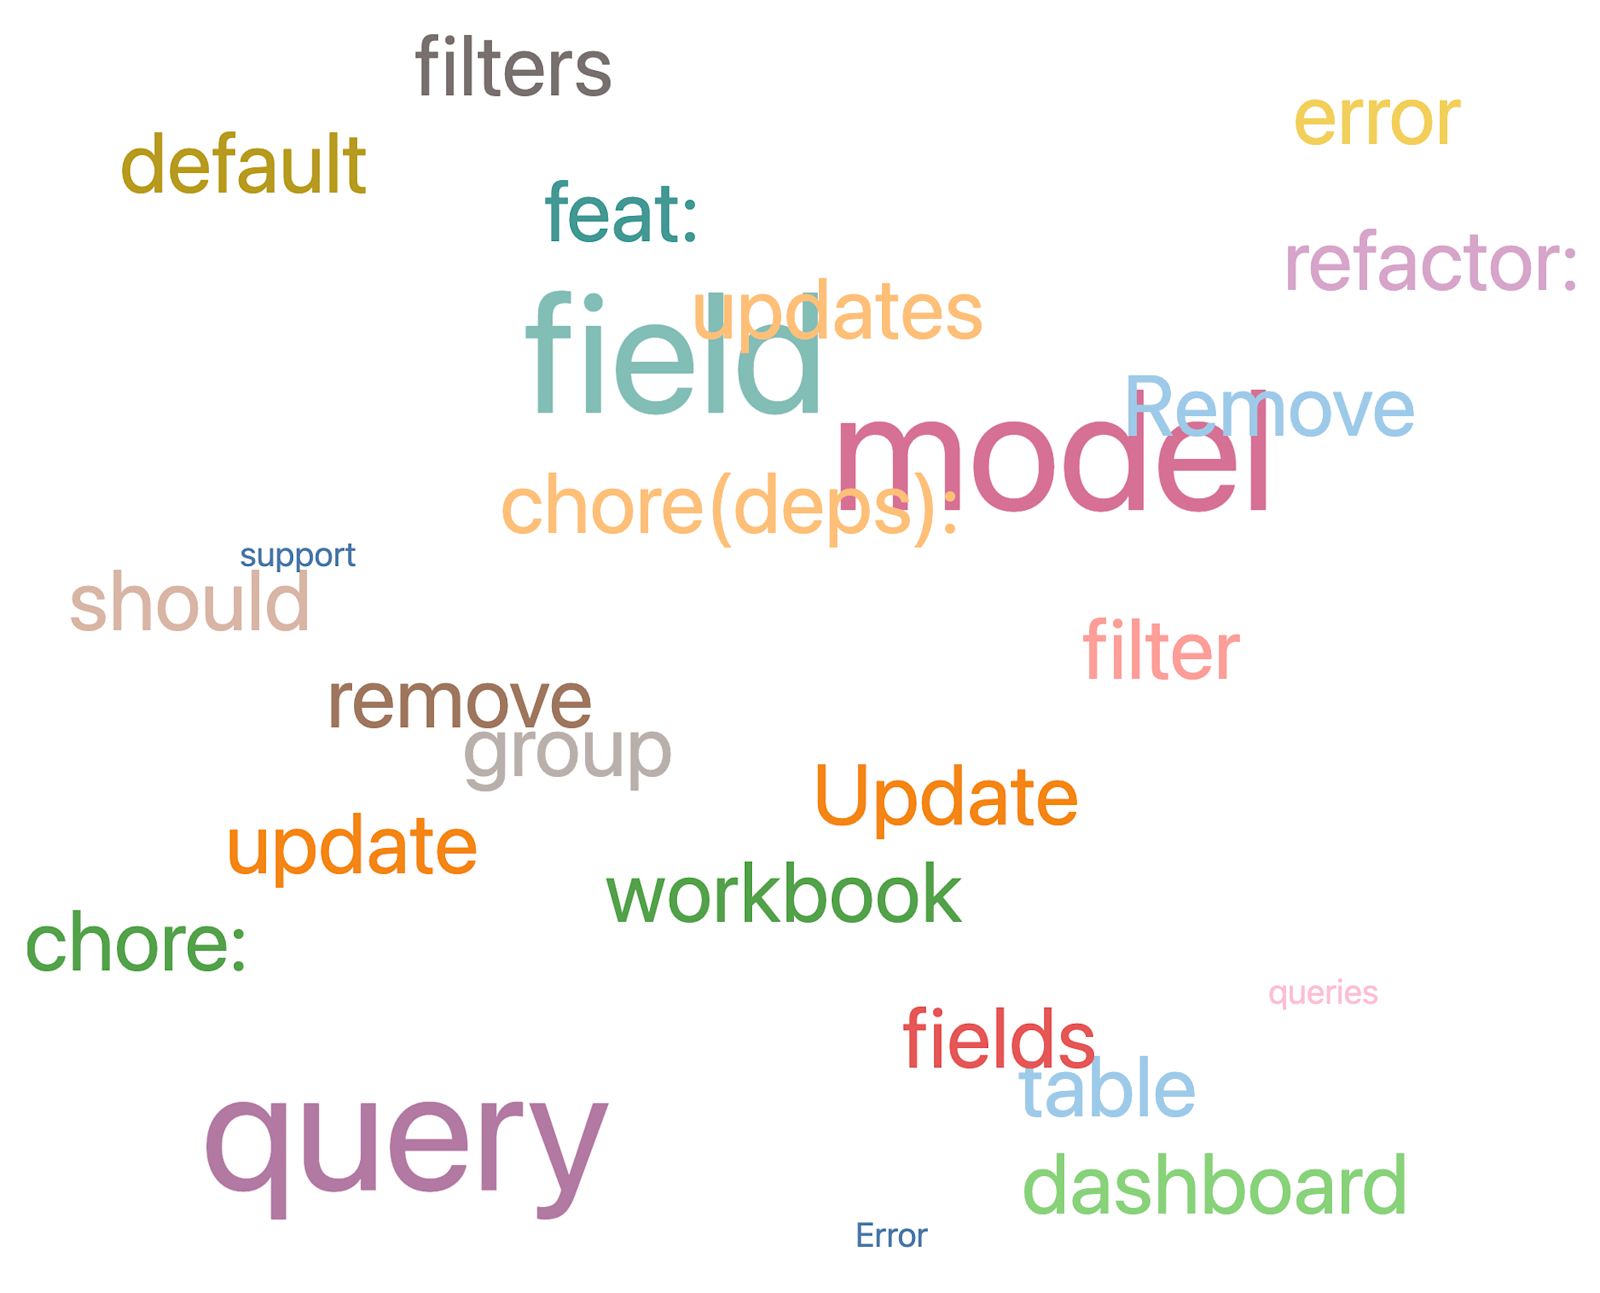
Word cloud #
Are you doing some text analysis? Take advantage of our Word Cloud custom visualization.
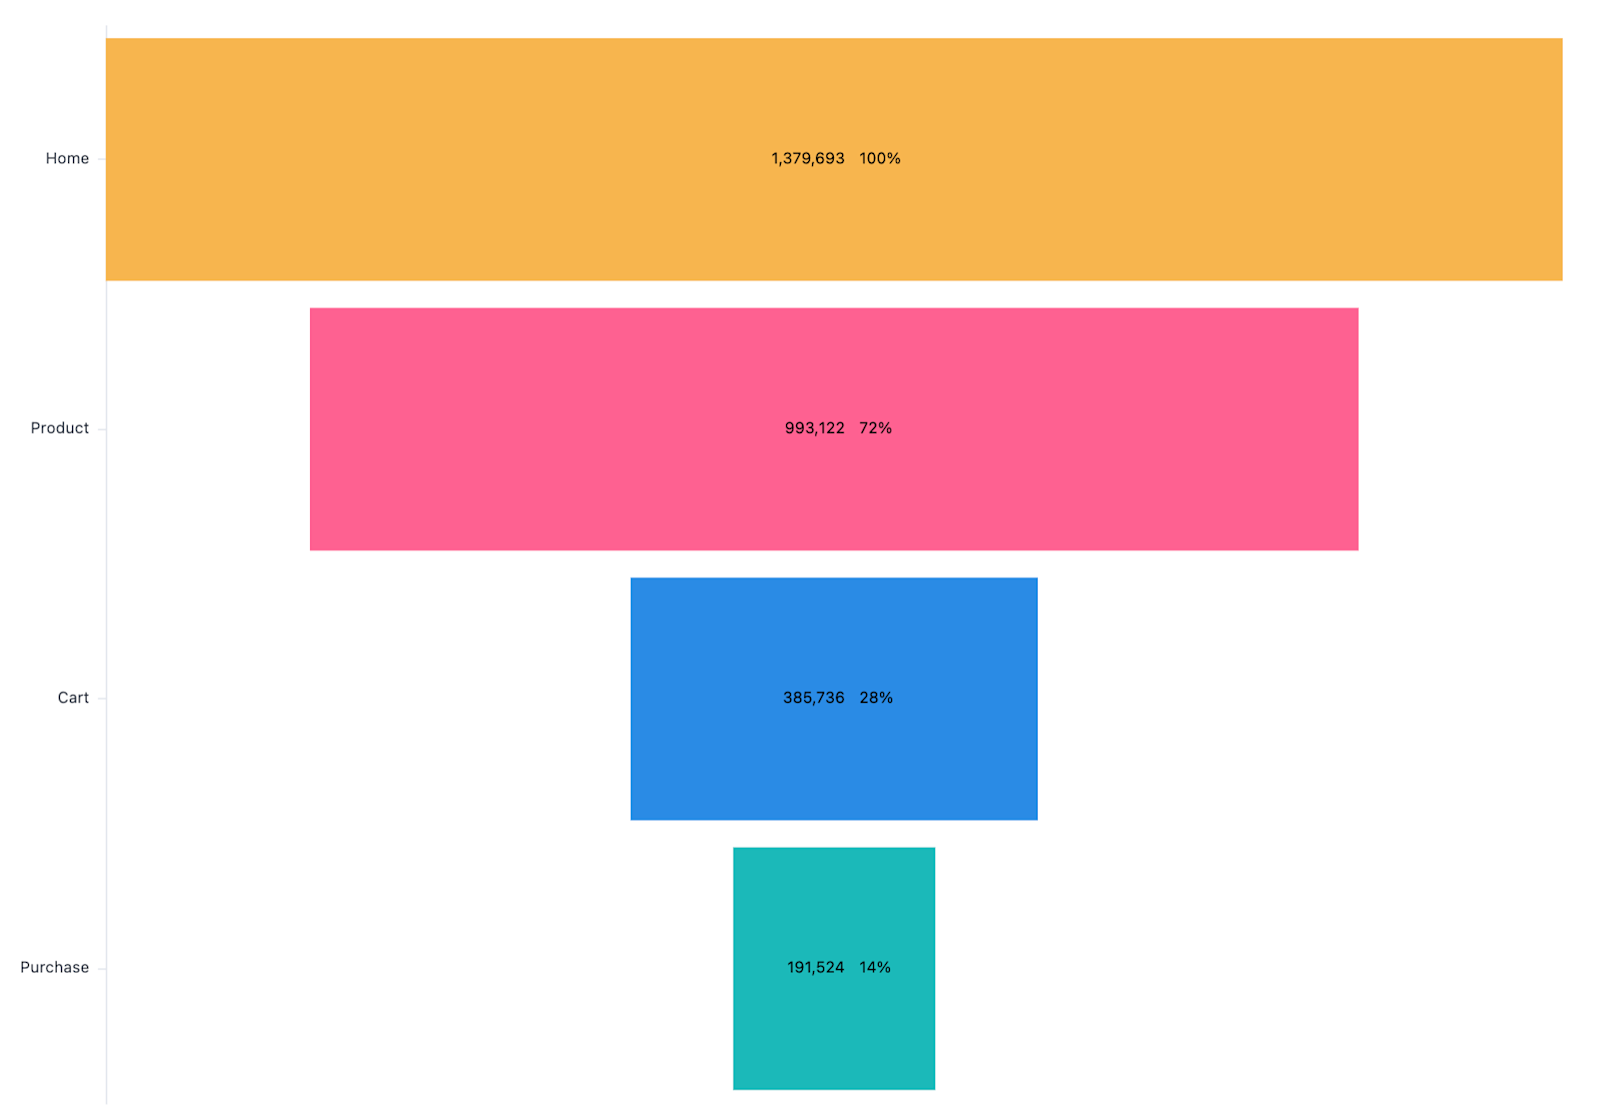
Funnel #
Are you looking to display your sales pipelines, marketing campaign analysis, customer journeys? Consider using the Funnel custom visualization.
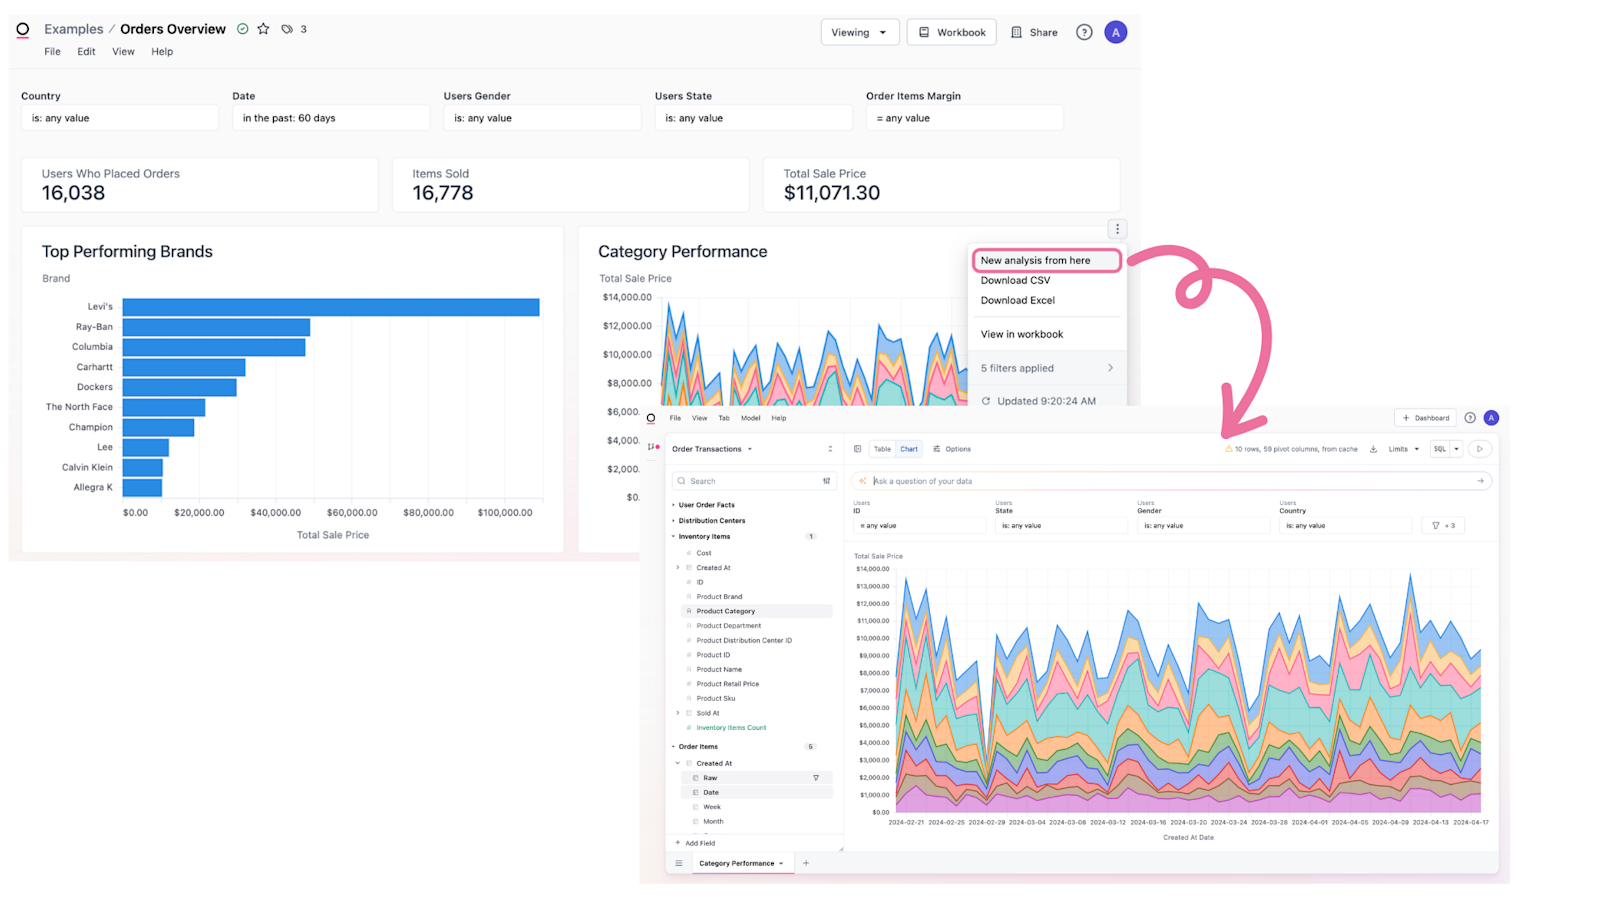
Jump from a Dashboard Vis into a New Workbook #
The New analysis from here... option on a dashboard tile’s menu allows users to start a new workbook from an existing dashboard tile - so users can riff on queries and dive in deeper without impacting the saved piece of content.
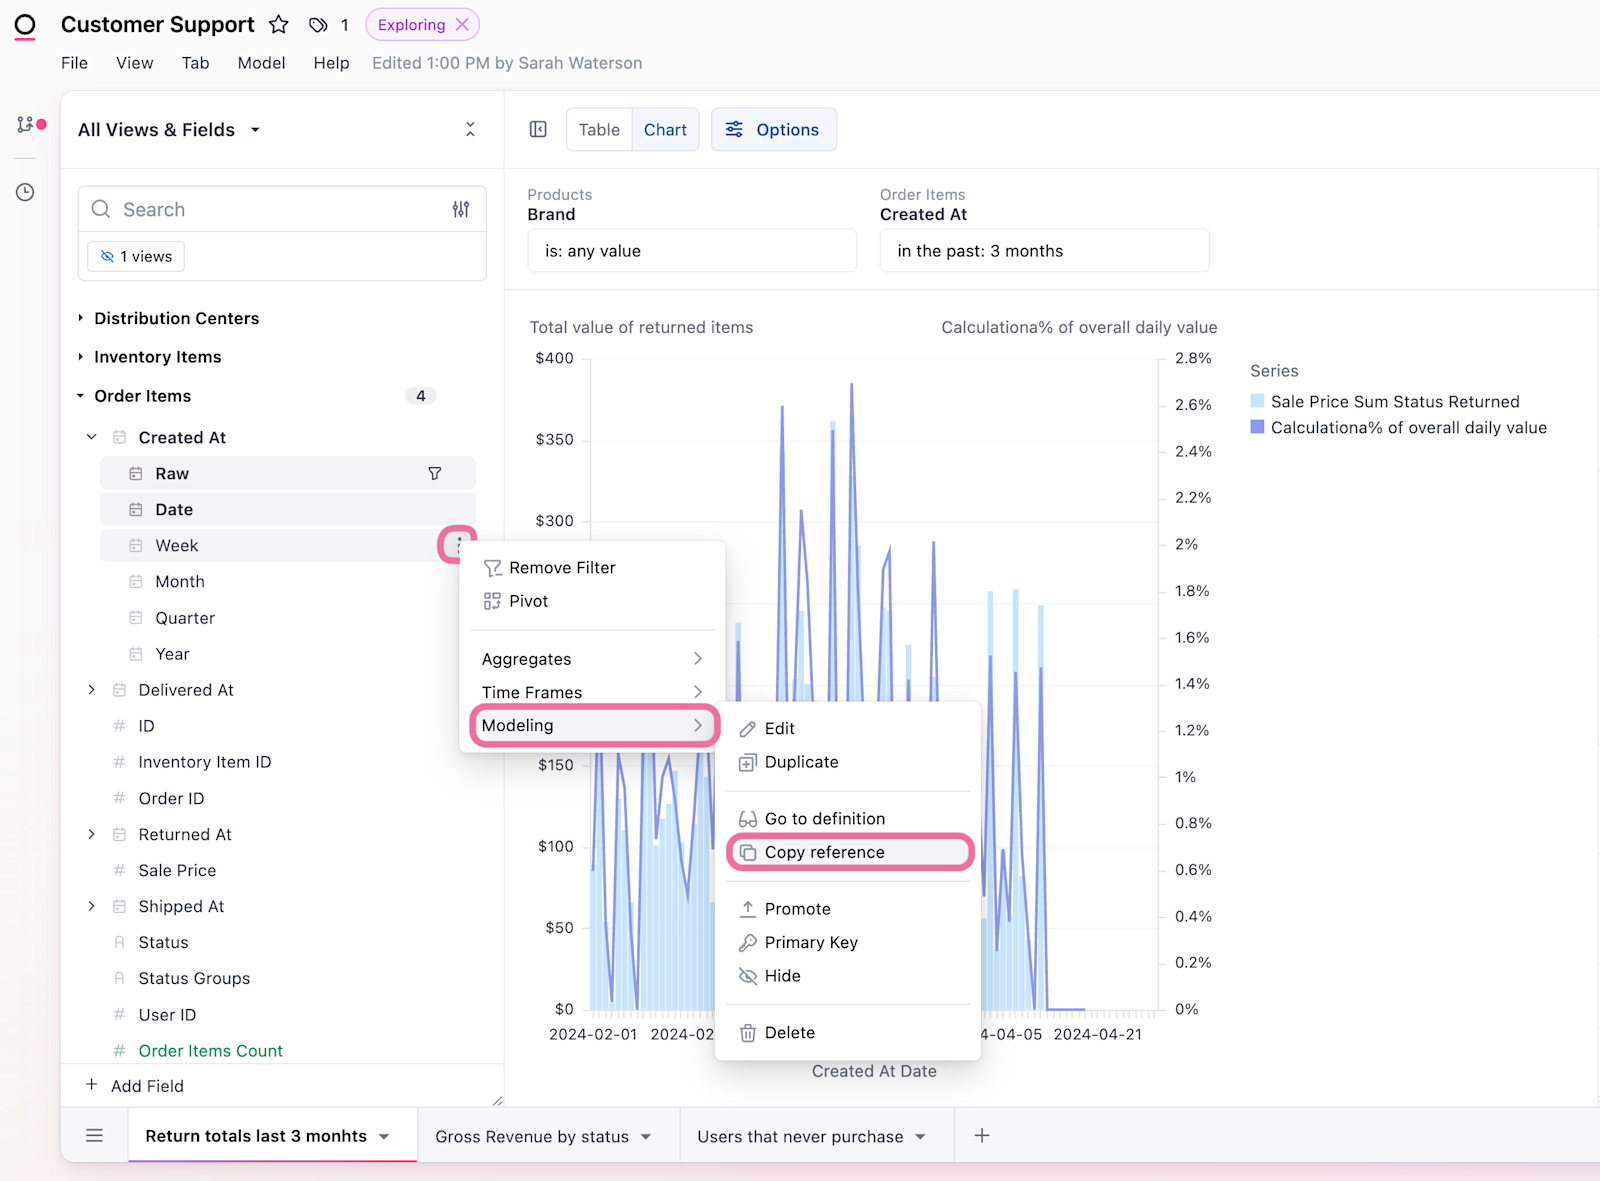
Other Improvements #
A new field Copy Reference menu option allows users to quickly copy a field name from the field selector in the workbook making custom field creation or SQL a little bit faster and easier!
Made improvements to speed up the SQL IDE on gigantic schema models where auto-complete was slowing typing and deletion.
Button styling control for embedded content - now your embedded dashboard's buttons can be any desired color - learn more about custom embed options in this doc
We now have case insensitive filtering (for when the database isn't as clean as you wished! 🧹).